Bootstrapping: figure out confidence intervals
Bootstrapping function of TableTorch computes confidence intervals with a given confidence level for the following common measures of each selected variable:
- mean (average);
- variance;
- standard deviation;
- 25th percentile;
- Median (50th percentile);
- 75th percentile.
It can also randomly sample a particular column the specified number of times so that you can calculate the desired statistic manually on a separate sheet.
In this article, we’ll explore possible applications of statistical metrics bootstrapping and learn how to use TableTorch’s bootstrapping feature.
Table of Contents
- Applications of bootstrapping
- Start TableTorch
- Calculating the common measures
- Resampling a single column N times
- Conclusion
Applications of bootstrapping
The bootstrapping method has a number of applications in both business and academia, for example:
- Confidence Interval Estimation: Constructing confidence intervals for population parameters.
- Model Validation: Assessing the stability and accuracy of predictive models.
- Risk Assessment: Estimating the probability of financial losses and other risks.
- Market Research: Analyzing customer data to predict trends and preferences.
- Performance Evaluation: Assessing employee performance and productivity.
- Inventory Management: Forecasting demand and optimizing stock levels.
- Financial Modeling: Simulating economic scenarios to inform investment decisions.
- Comparative Studies: Comparing different groups or conditions in experimental research.
In this article, we’ll delve into the details of bootstrapping. Before we proceed, please ensure that you have installed the TableTorch add-on for Google Sheets, as discussed in the following section.
Start TableTorch
- Install TableTorch to Google Sheets via Google Workspace Marketplace. More details on initial setup.
- Click on the TableTorch icon
on right-side panel of Google Sheets.
Calculating the common measures
Example data
Let’s start with a following sheet:
| A | B |
|---|---|
| New Design: Before | New Design: After |
| 9.7 | 8.1 |
| 13.9 | 13.2 |
| 10.9 | 9.2 |
| 12.4 | 9.6 |
| 11.5 | 10.6 |
| 13.8 | 12.1 |
| 11.6 | 9.7 |
| 12.5 | 10.3 |
| 13.6 | 11.8 |
| 12.5 | 11.8 |
| 12.7 | 11.3 |
| 12.3 | 10.9 |
| 13.6 | 12.3 |
| 11.4 | 9.7 |
| 14.6 | 12.7 |
| 12.1 | 9.9 |
| 8.9 | 8.1 |
| 12.5 | 10.4 |
| 11.8 | 11.4 |
| 12.4 | 10.7 |
| 15.0 | 13.8 |
| 12.0 | 10.9 |
| 11.9 | 10.7 |
| 12.4 | 10.5 |
| 8.3 | 6.8 |
| 11.5 | 10.0 |
| 13.0 | 10.9 |
| 12.5 | 10.8 |
| 10.4 | 8.9 |
| 13.9 | 12.2 |
| 11.6 | 11.0 |
| 7.7 | 6.4 |
| 9.8 | 8.4 |
| 15.5 | 14.5 |
| 11.2 | 9.1 |
| 13.2 | 11.5 |
| 11.3 | 10.0 |
| 10.4 | 8.5 |
| 13.1 | 12.6 |
| 13.8 | 12.1 |
| 10.4 | 8.5 |
| 13.5 | 11.8 |
| 13.5 | 12.3 |
| 13.7 | 11.6 |
| 13.2 | 11.3 |
| 11.8 | 10.9 |
| 13.1 | 11.7 |
| 12.5 | 11.8 |
| 13.7 | 11.9 |
| 12.5 | 11.6 |
This sheet is also referenced on the hypothesis testing page. It describes time in seconds it took participants of an experiment to perform a specified action before and after a UI design change.
Computation
-
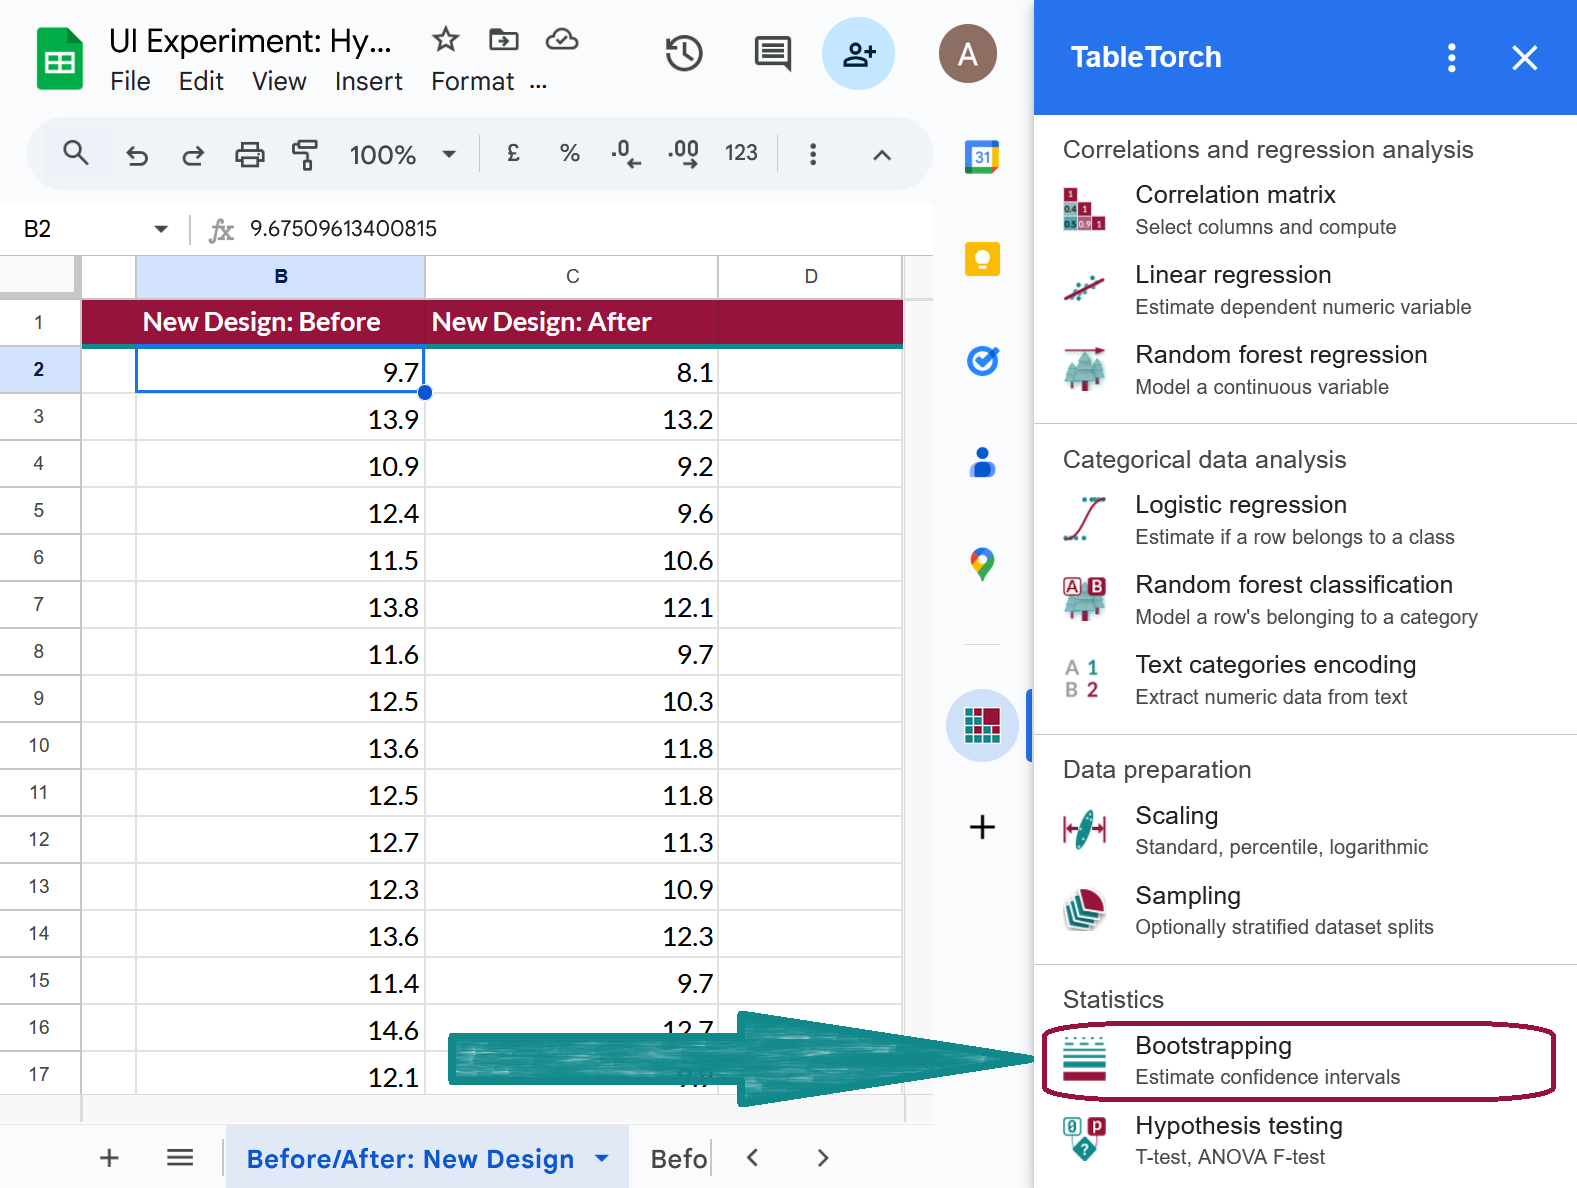
➡️ Select any cell of the data table, open TableTorch and click the Bootstrapping menu item.
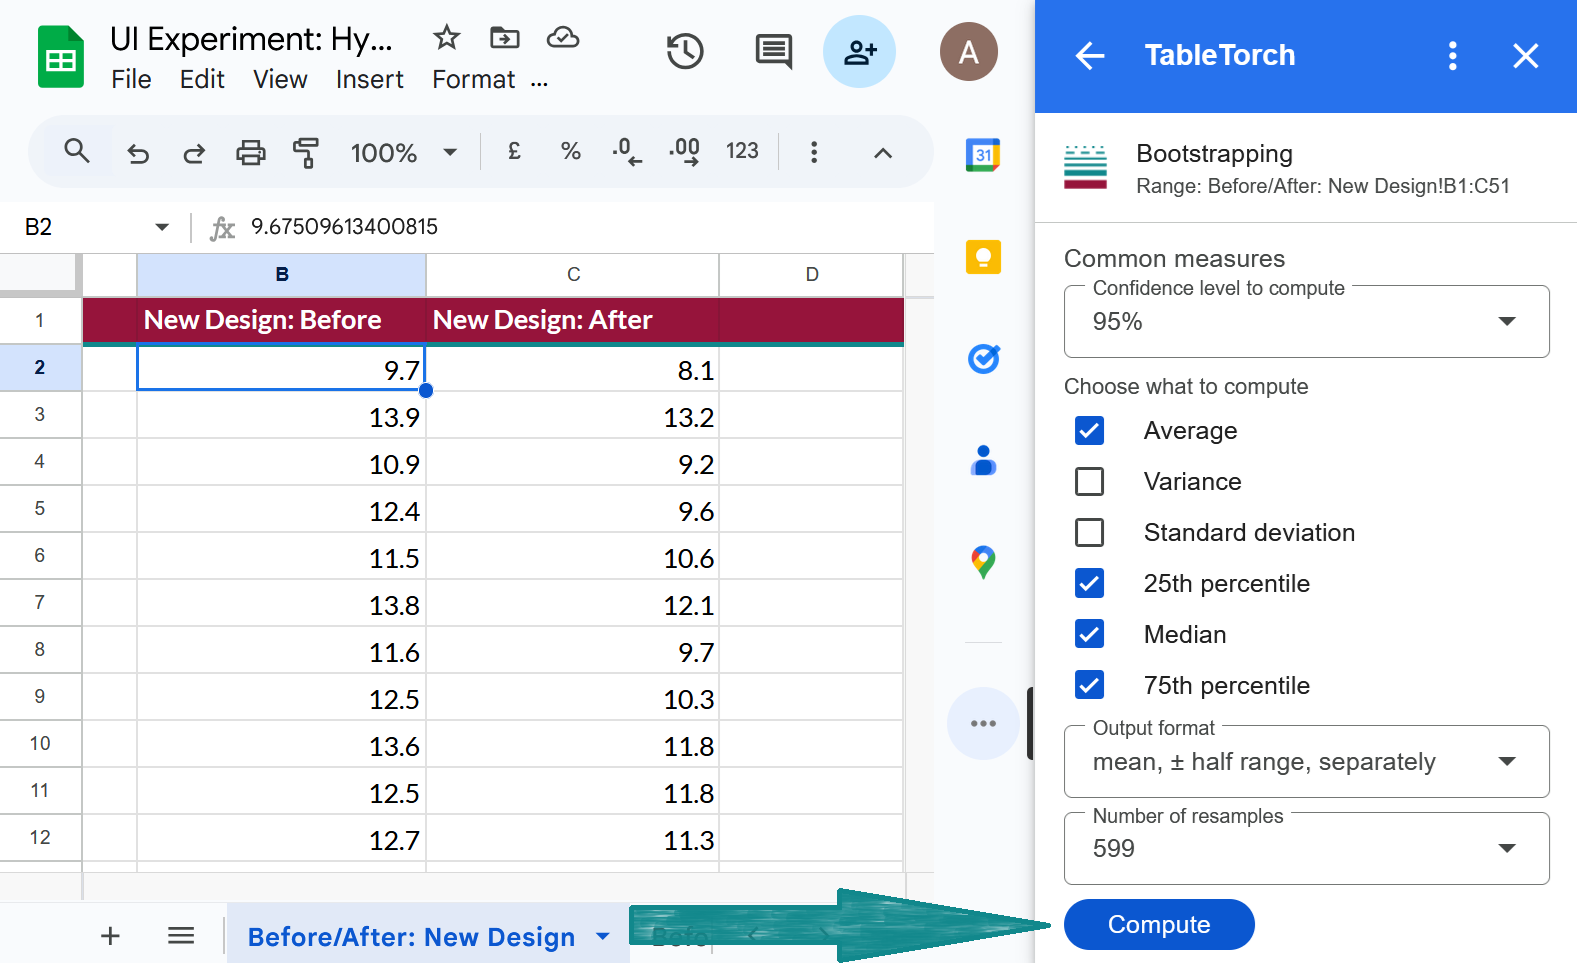
- ➡️ If necessary, correct the options and click the Compute button.
- confidence level — 95% by default, indicates a probability that the confidence interval contains the true parameter. Generally speaking, the higher the confidence level, the wider the calculated confidence interval.
- parameters to compute — by default, average, 25th, 50th and 75th percentiles are computed but you can also include variance and standard deviation as well.
- output format — determines the resulting sheet format. Let’s choose mean ± half range, separately for simplicity. This way, each measure will be presented with a mean in one column and half of a range (margin of error) in another column.
- number of resamples — sets how many dataset resamples TableTorch will do while
bootstrapping to calculate the requested common measures.
-
Results will be presented on a new sheet.
Analysis of the bootstrapped metrics
If we transpose the results and present them as three columns for confidence intervals’ minimums, means, and maximums, they can be shown in the following table:
| A | B | C |
|---|---|---|
| Average | New Design: Before | New Design: After |
| Minimum | 11.78 | 10.3 |
| Mean | 12.19 | 10.77 |
| Maximum | 12.66 | 11.2 |
| 25th percentile | New Design: Before | New Design: After |
| Minimum | 10.54 | 8.95 |
| Mean | 11.22 | 9.83 |
| Maximum | 11.98 | 10.61 |
| Median | New Design: Before | New Design: After |
| Minimum | 11.88 | 10.49 |
| Mean | 12.34 | 10.96 |
| Maximum | 12.68 | 11.47 |
| 75th percentile | New Design: Before | New Design: After |
| Minimum | 12.54 | 11.44 |
| Mean | 13.18 | 11.78 |
| Maximum | 13.68 | 12.22 |
The experiment’s hypothesis was that the new design would reduce the time it takes an operator to perform a certain action. Let’s see if the bootstrapped metrics support this:
- The average time decreased by
1.42seconds (12.19 - 10.77). - The 95% confidence interval for the average time after the intervention ends at
11.2, which is lower than the11.78start of the confidence interval for the average time before the intervention. This suggests that with 95% confidence, the change in average time is not due to chance, showing an effect of at least-0.58seconds. - The median and the 75th percentile also show significant decreases:
- Median decreased by at least
0.41seconds. - 75th percentile decreased by
0.32seconds.
- Median decreased by at least
- For the 25th percentile, although the confidence interval after the intervention is lower than before, they overlap slightly, indicating that the effect might not be statistically significant for the fastest 25% of operators.
* — Learn more about this experiment on the page about hypothesis testing.
Resampling a single column N times
TableTorch can be very helpful in computation of several highly common metrics as described in the previous sections of this article.
However, it can also help you bootstrap whatever metric you’d like if it possible to calculate it with a simple Google Sheets formula.
The following part of this article will discuss how to do just that.
Bootstrapping a custom metric
For demonstration purposes, let’s bootstrap the difference between the smallest and the largest timing, that is, the timings range, of the dataset presented above.
Step 1: resample the original column
-
➡️ Select any cell of the data table, open TableTorch and click the Bootstrapping menu item.
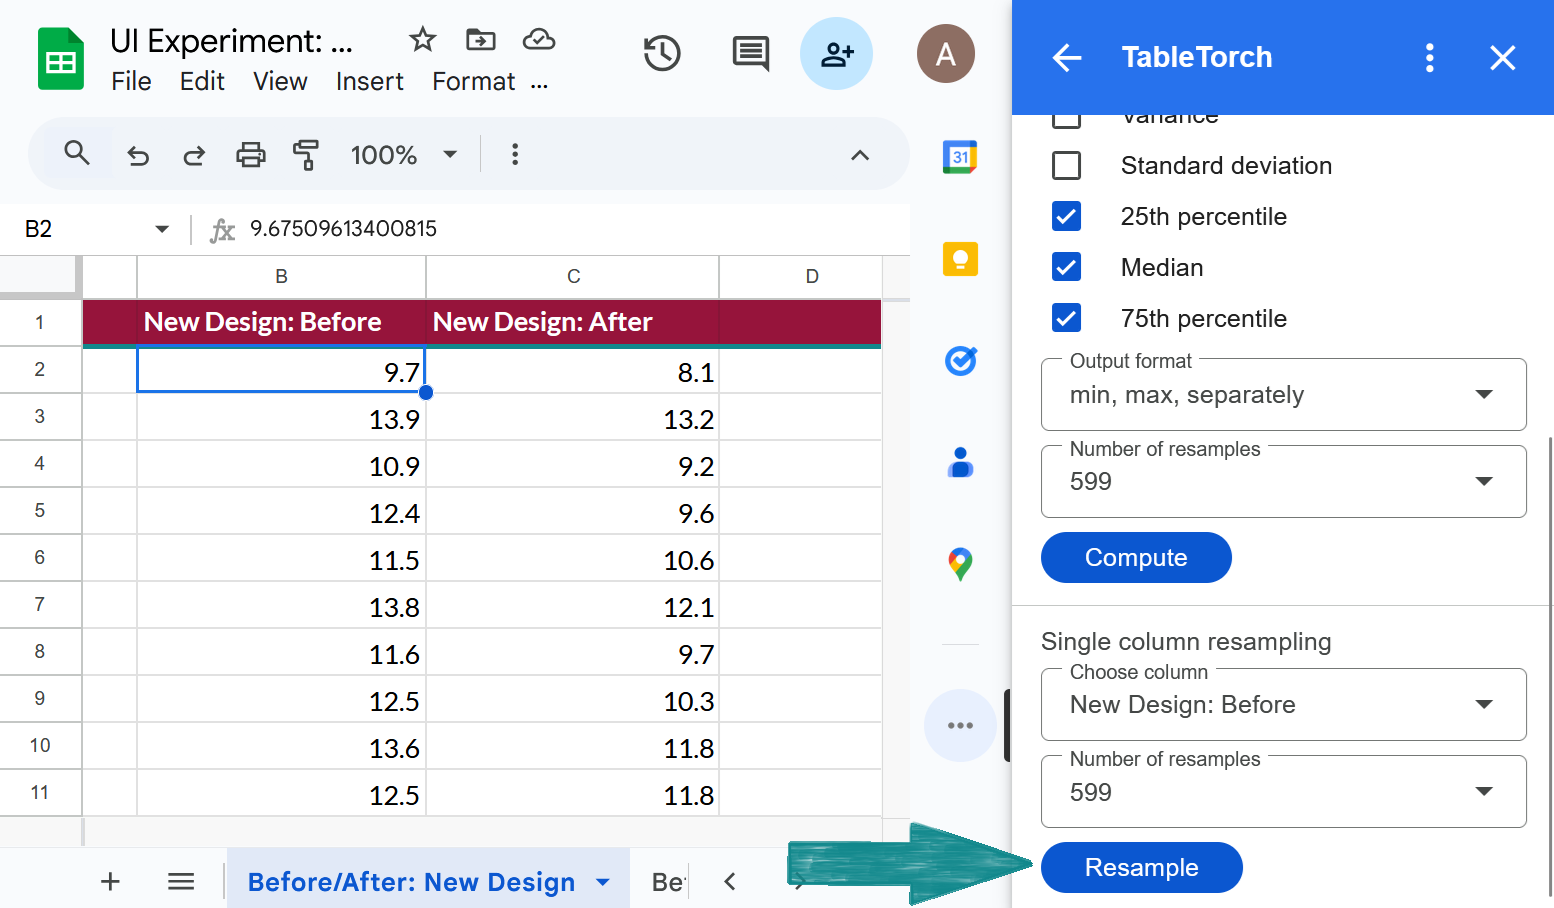
- ➡️ If necessary, correct the options and click the Resample button.
- Choose the column to resample: New Design: Before in this example.
-
Select the number of resamples: 599 in this example.
NOTE: depending on the size of the original dataset, it might not always be possible to do this many resamples due to Google Sheets limit on the number of cells with data on a single spreadsheet.
-
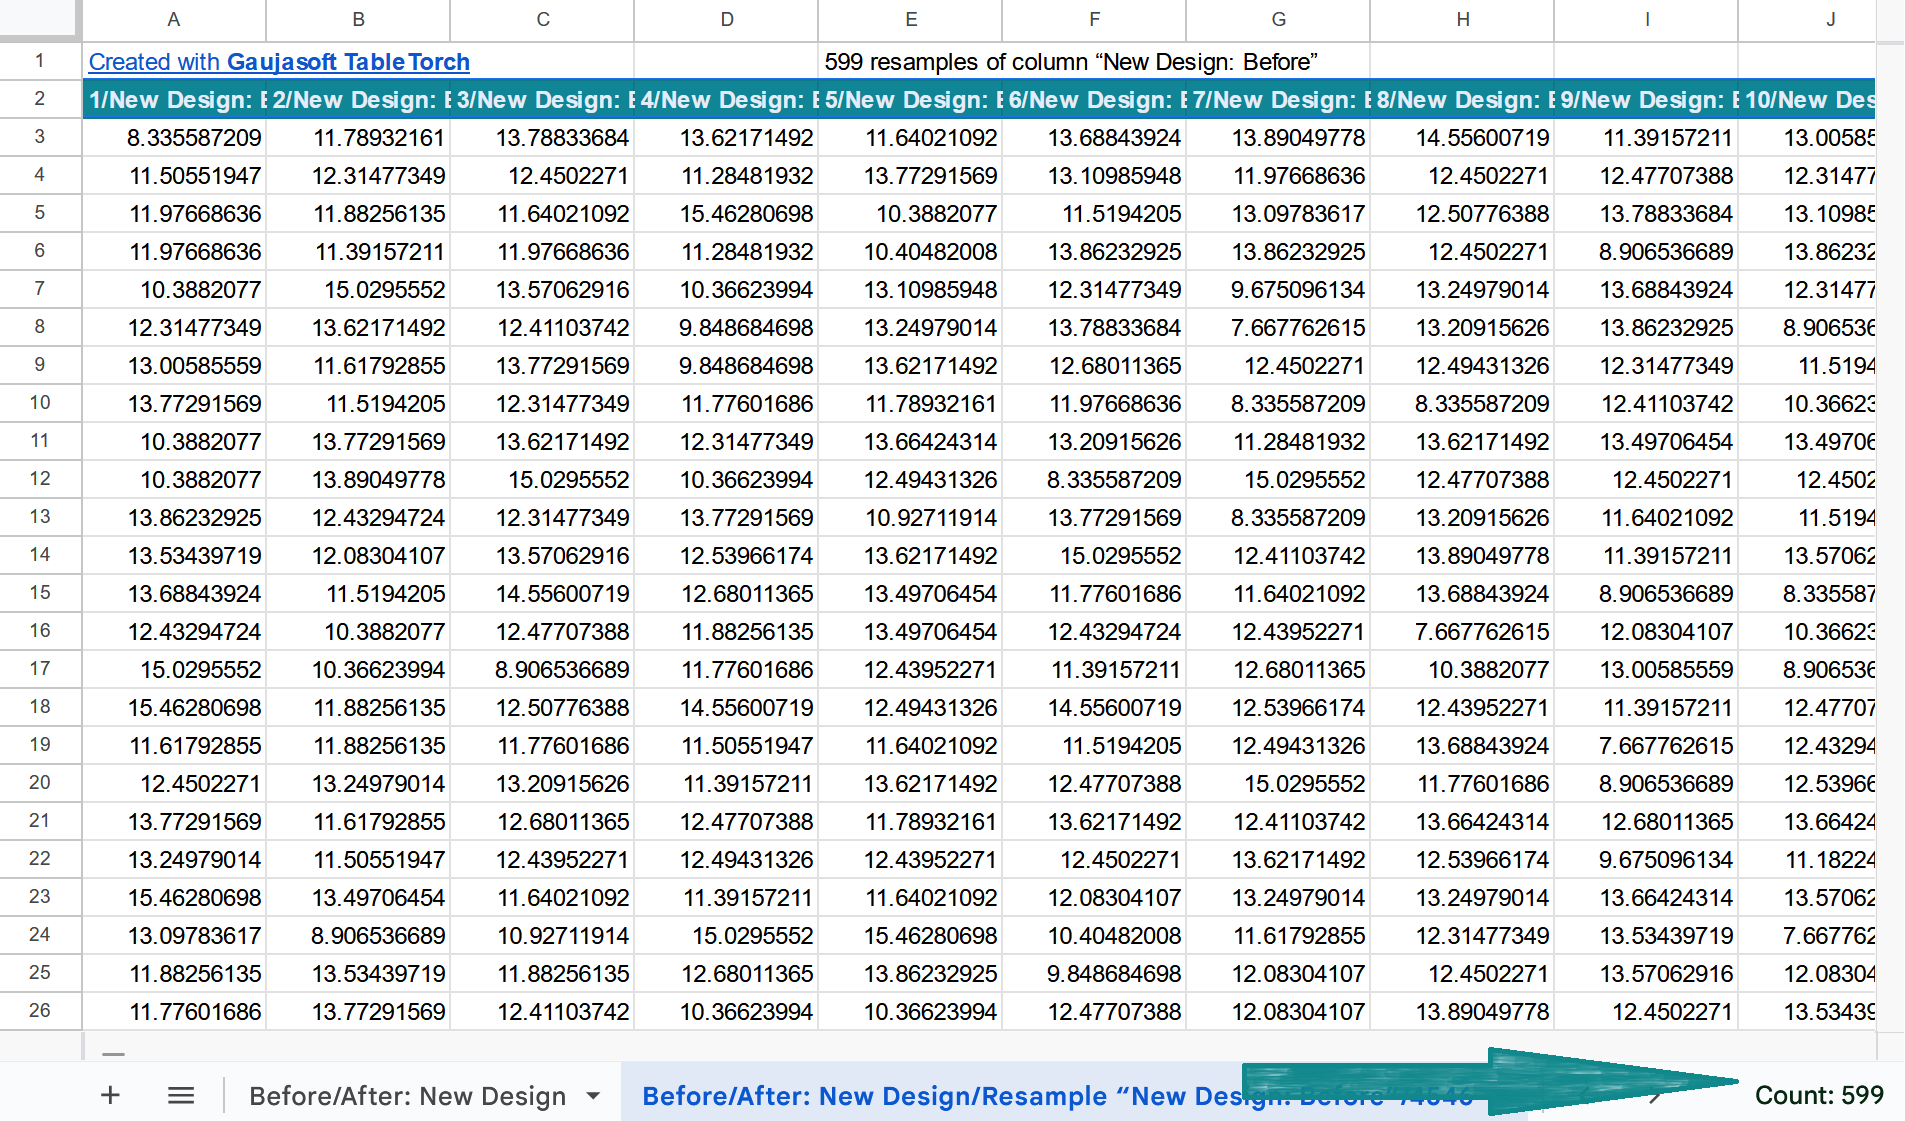
A sheet with 599 resamples of the original column will be presented shortly.
Step 2: compute the desired metric for all the resamples
-
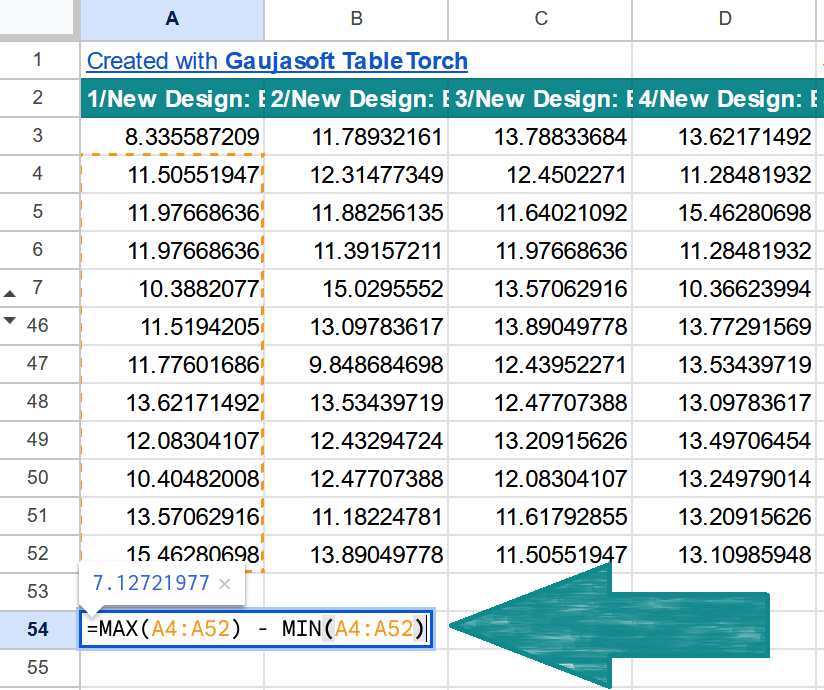
Let’s put a formula for range computation below the first resampled column:
=MAX(A4:A52) - MIN(A4:A52) -
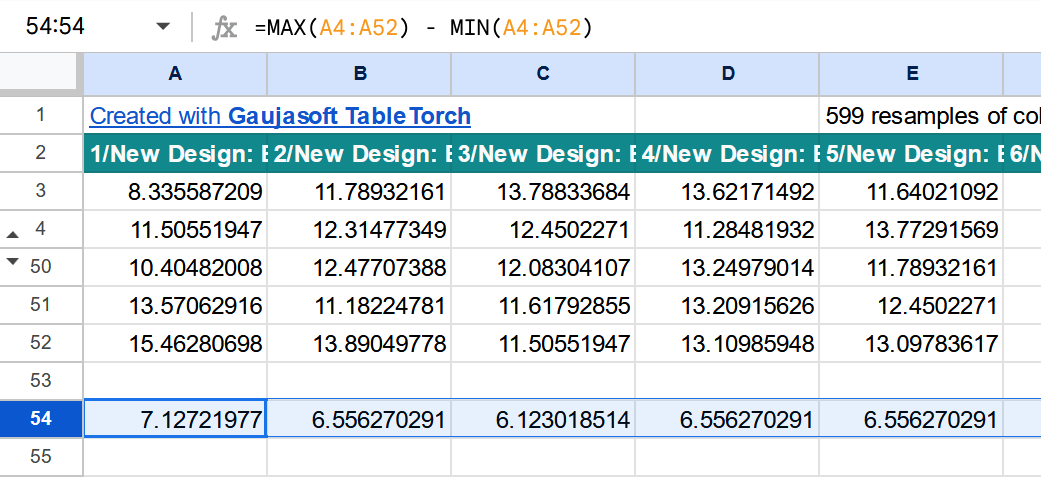
Then, just copy this formula horizontally for all the produced columns:
Step 3: calculate the confidence interval
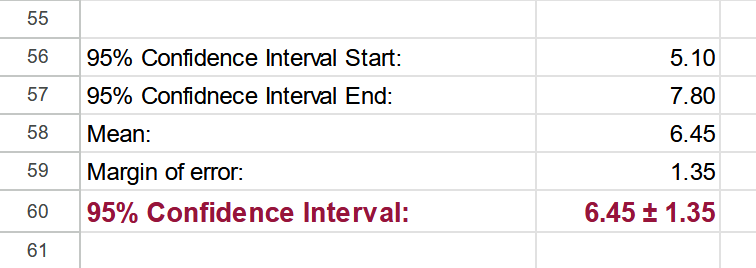
Now enter the formulas into rows 56-60 to calculate the 95% confidence interval:
- 95% Confidence Interval Start::
=PERCENTILE(A54:WA54, 0.025) - 95% Confidence Interval End::
=PERCENTILE(A54:WA54, 0.975) - Mean::
=AVERAGE(B56:B57) - Margin of error:
=(B57-B56)/2 - 95% Confidence Interval::
=CONCATENATE(TEXT(B58, "0.00"), " ± ", TEXT(B59, "0.00"))
In this fashion, it’s possible to bootstrap any computable with a Google Sheets formula metric.
If you’d like to compute 99% confidence interval instead, use 0.005 and 0.995 percentiles in the formulas for confidence interval above, accordingly.
Conclusion
The bootstrapping feature of the TableTorch add-on for Google Sheets offers a robust, user-friendly tool for generating accurate confidence intervals without relying on traditional distribution assumptions. In this article, we demonstrated how to bootstrap common metrics such as averages, medians, and the 25th and 75th percentiles, as well as any custom metric that can be computed using Google Sheets formulas.
TableTorch’s seamless integration with Google Sheets ensures that both novice and experienced analysts can harness the power of resampling techniques to compute reliable confidence intervals.
Google, Google Sheets, Google Workspace and YouTube are trademarks of Google LLC. Gaujasoft TableTorch is not endorsed by or affiliated with Google in any way.
Let us know!
Thank you for using or considering to use TableTorch!
Does this page accurately and appropriately describe the function in question? Does it actually work as explained here or is there any problem? Do you have any suggestion on how we could improve?
Please let us know if you have any questions.
- E-mail: ___________
- Facebook page
- Twitter profile

